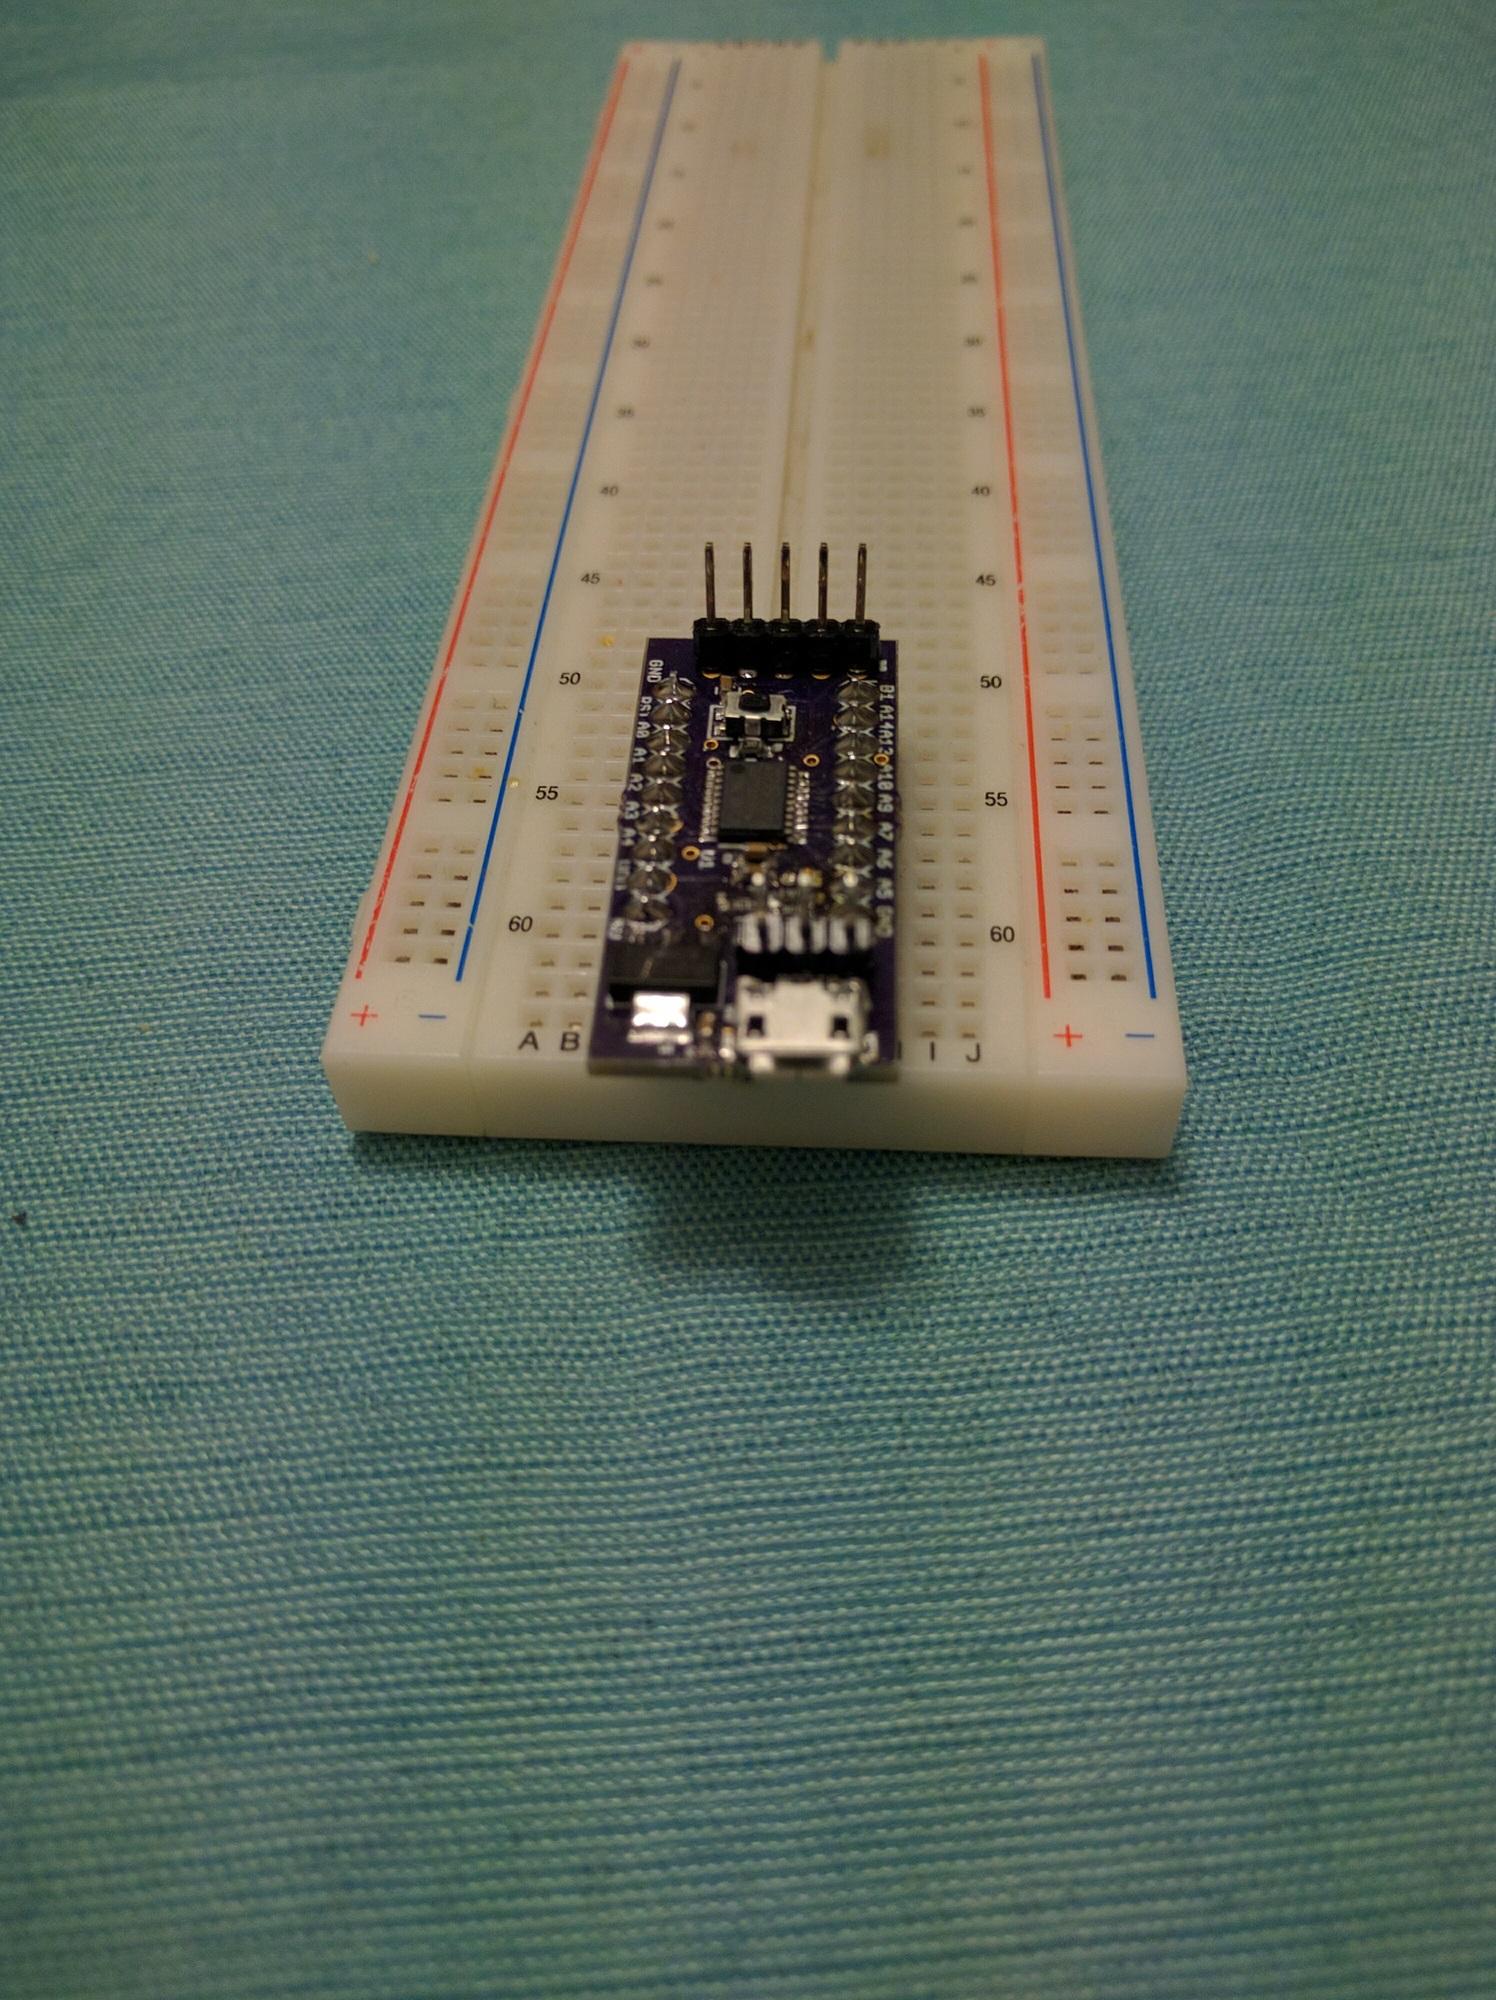
I’ve been letting these boards run to see what happens. The TCXO’s aging spec is 1ppm/year, which is about 0.083ppm/month (it’s not a linear thing, but this is a decent estimation). I set the calibration on June 7th (a little less than a month ago), and it’s changed in frequency by about 0.060ppm since then. Since this is a 12MHz TCXO, 0.060ppm is a 0.72Hz change.
First, an image of the TCXO’s raw frequency vs the temperature compensated frequency. You can see the compensated frequency is much less noisy and much closer to 0ppm.
Image
Zooming in to just the temperature compensated frequency:
Image
99.9% of all samples were between -0.030ppm and -0.072ppm, a 0.042ppm range. This range is my clock’s uncertainty. The situation is slightly better than that, as 24 hour periods have a smaller range. You can see the aging is around 0.015ppm/week (1ppm/year is roughly 0.019ppm/week).
The new boards also have a LSE, but it’s just a regular crystal. I’m using TIM14 to compare the LSE frequency to the TCXO.
Some notes about measuring the LSE:
- To lower the interrupt rate, I used the MCO to get LSE/128, and then TIM14’s input capture divides that by /8 to get a final interrupt rate of 32Hz.
- TIM14 is a 16 bit timer, and TIM2 is a 32 bit timer. I used both to measure the exact difference in length of 1 second between the LSE and HSE.
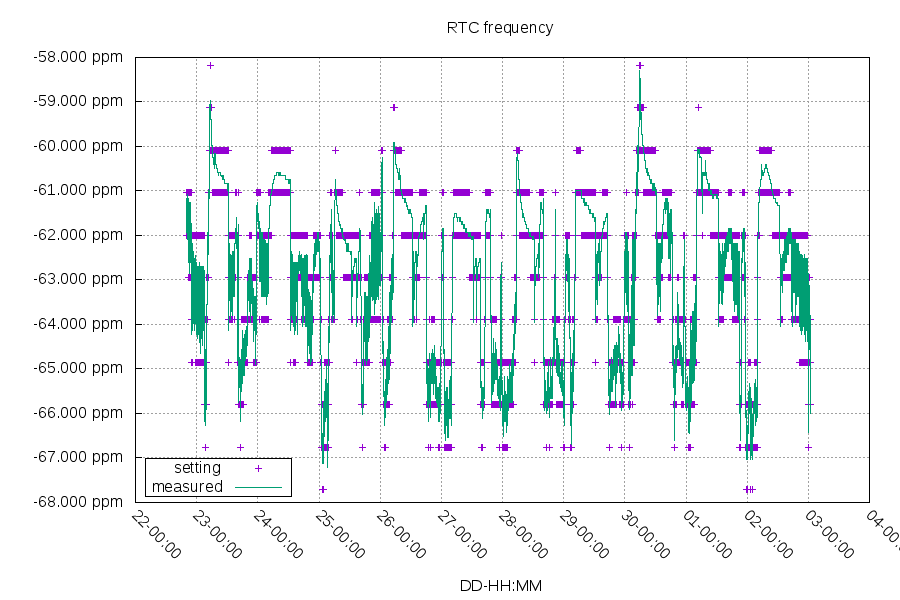
- The RTC’s frequency adjustment is in steps of 0.954ppm units. So I used dithering to average out the error. I set a new RTC adjustment every 30 seconds
- I configured the RTC to have 1/1024 second units (slightly better than 1 millisecond)
The green is the difference in frequency between the LSE and HSE. I compared against the temperature compensated frequency from the HSE. The purple is the RTC frequency adjustment value used.
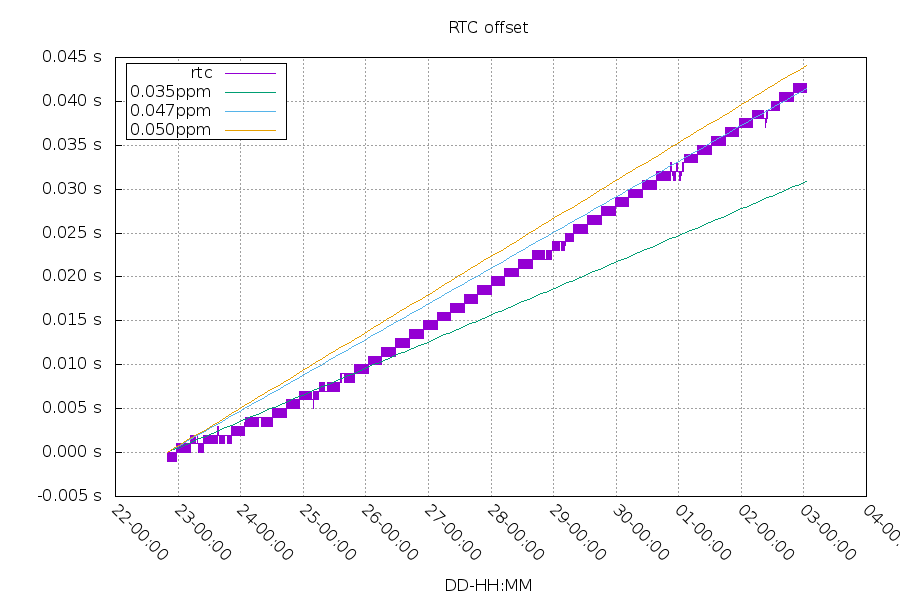
The RTC clock was set to a 0 second offset at the start and left to run only on frequency control. The offset of the RTC clock was compared to the GPS module’s PPS. The blocky nature of the purple line comes from the 1/1024 second unit limitation. I’ve included three frequency error lines to show the ranges of frequency error.
Bonus pictures:
Temperature change between every 64 second reporting period.
Image
Coin cell battery verses temperature (adjusted for changes in supply voltage).
Image